Abstract:Gold has come under renewed pressure as Treasury yields and the U.S. dollar regain strength. Here is what the latest move in XAU/USD may mean, and the key technical levels now in focus.
Gold has started the week on the defensive, with recent price action showing a clear loss of momentum after a sharp pullback in XAU/USD. The move has raised a familiar question: is this just a temporary correction, or is the market entering a deeper bearish phase?
For now, the short-term tone remains fragile. Gold is facing pressure not only from its own technical breakdown, but also from the growing appeal of competing safe-haven assets.
 Contents
Treasury yields are taking some of golds shine
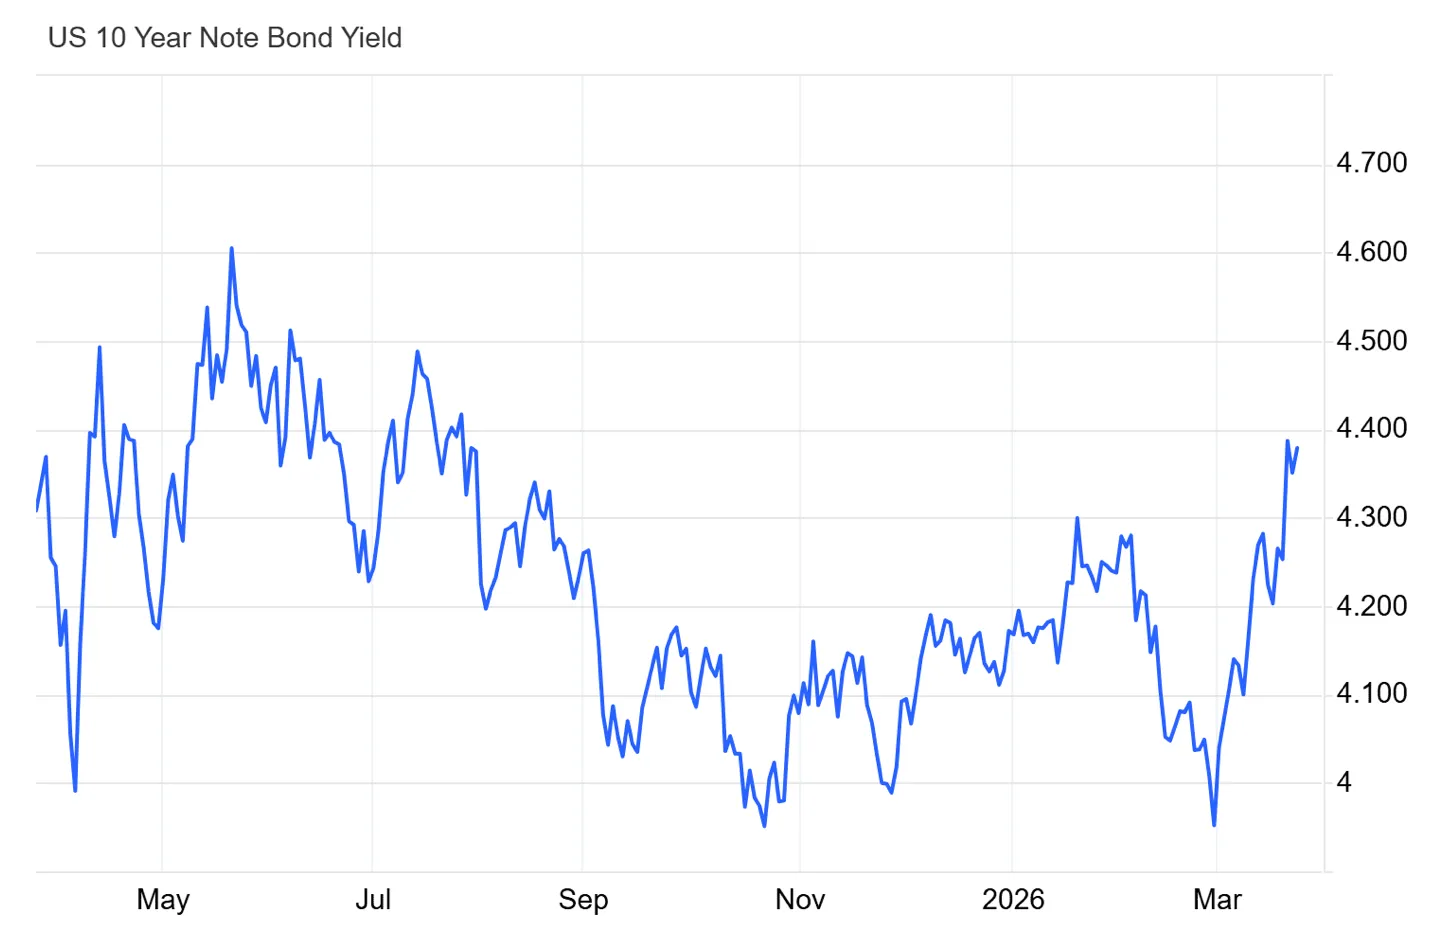
One of the main forces working against gold at the moment is the bond market. After the latest policy signals from the Federal Reserve, U.S. Treasury yields have moved higher again, with the 10-year yield approaching levels around 4.4%.
That matters because gold offers no yield. When government bonds become more attractive, especially in a market still looking for defensive positioning, part of the capital that might otherwise move into gold can shift into fixed income instead. In that sense, rising yields are not just a macro backdrop — they are a direct headwind for bullion.
The recent rebound in yields suggests that investors are once again willing to hold interest-bearing assets for safety and stability, which makes it harder for gold to recover quickly.
A firmer dollar adds to the pressure
The move in Treasuries has also supported the U.S. dollar. As yields rise, dollar-denominated assets tend to attract more demand, and that strengthens the greenback in the process.
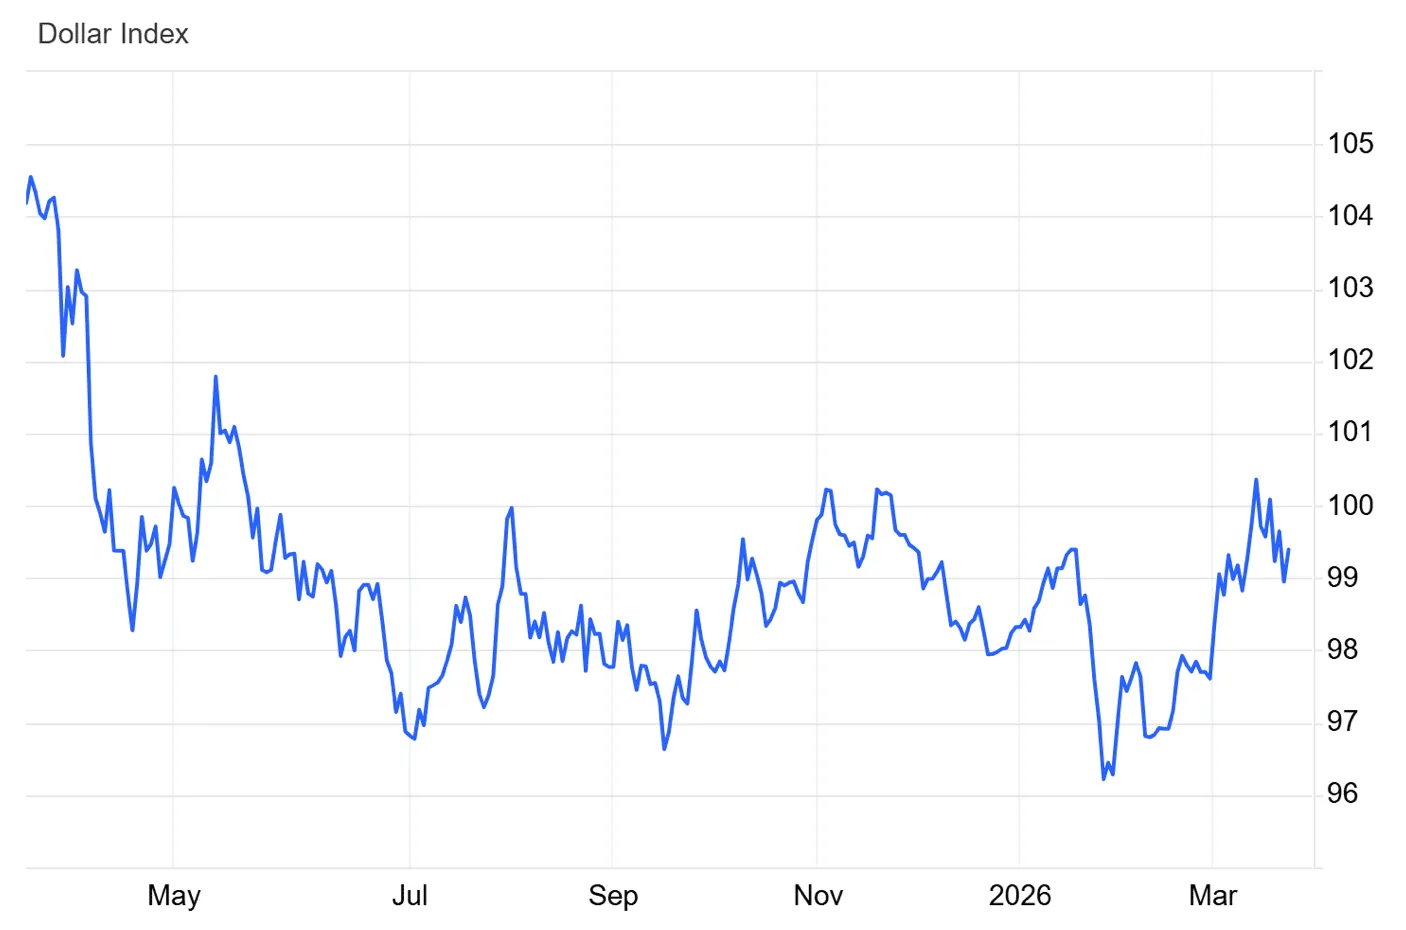
That dynamic is important for gold because XAU/USD is priced in dollars. When the dollar strengthens, gold becomes more expensive for non-dollar buyers, which can weigh on demand. Recent movement in the Dollar Index suggests the currency is holding up relatively well, and that reduces one of the conditions gold usually benefits from.
Put simply, gold is currently dealing with two pressures at once: stronger bond yields and a firmer dollar.
Risk sentiment is weak, but gold is not fully benefiting
Normally, a nervous market would help gold. When confidence falls and risk appetite fades, investors often rotate toward traditional defensive assets.
But this time, the relationship looks less straightforward.
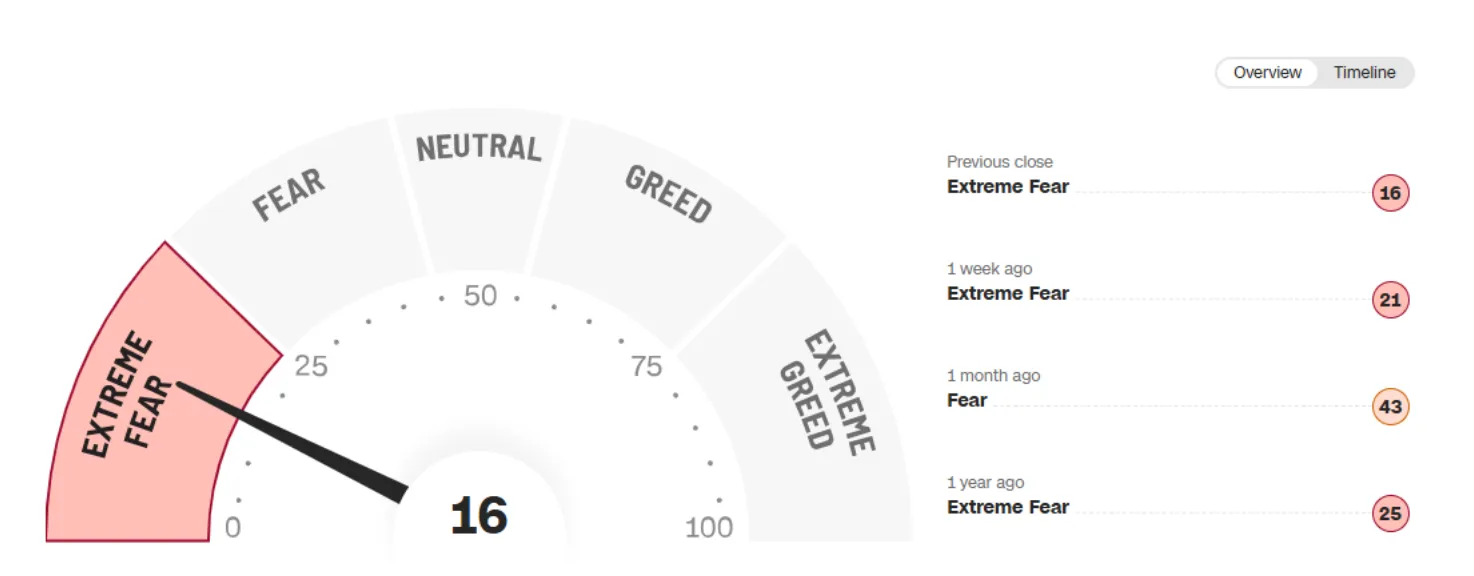
Market sentiment remains soft, with fear indicators still sitting in deeply cautious territory. Yet gold has not managed to convert that nervousness into stable buying support. That suggests investors are not treating gold as the first refuge in this phase of the market. Instead, part of that defensive flow appears to be moving elsewhere.
That disconnect is one reason the recent drop in gold has felt more persistent than many traders initially expected.
Technical picture: the uptrend has been damaged
From a chart perspective, the recent selloff has done real technical damage. Gold had been holding a clear upward structure for months, but that pattern has now weakened significantly.
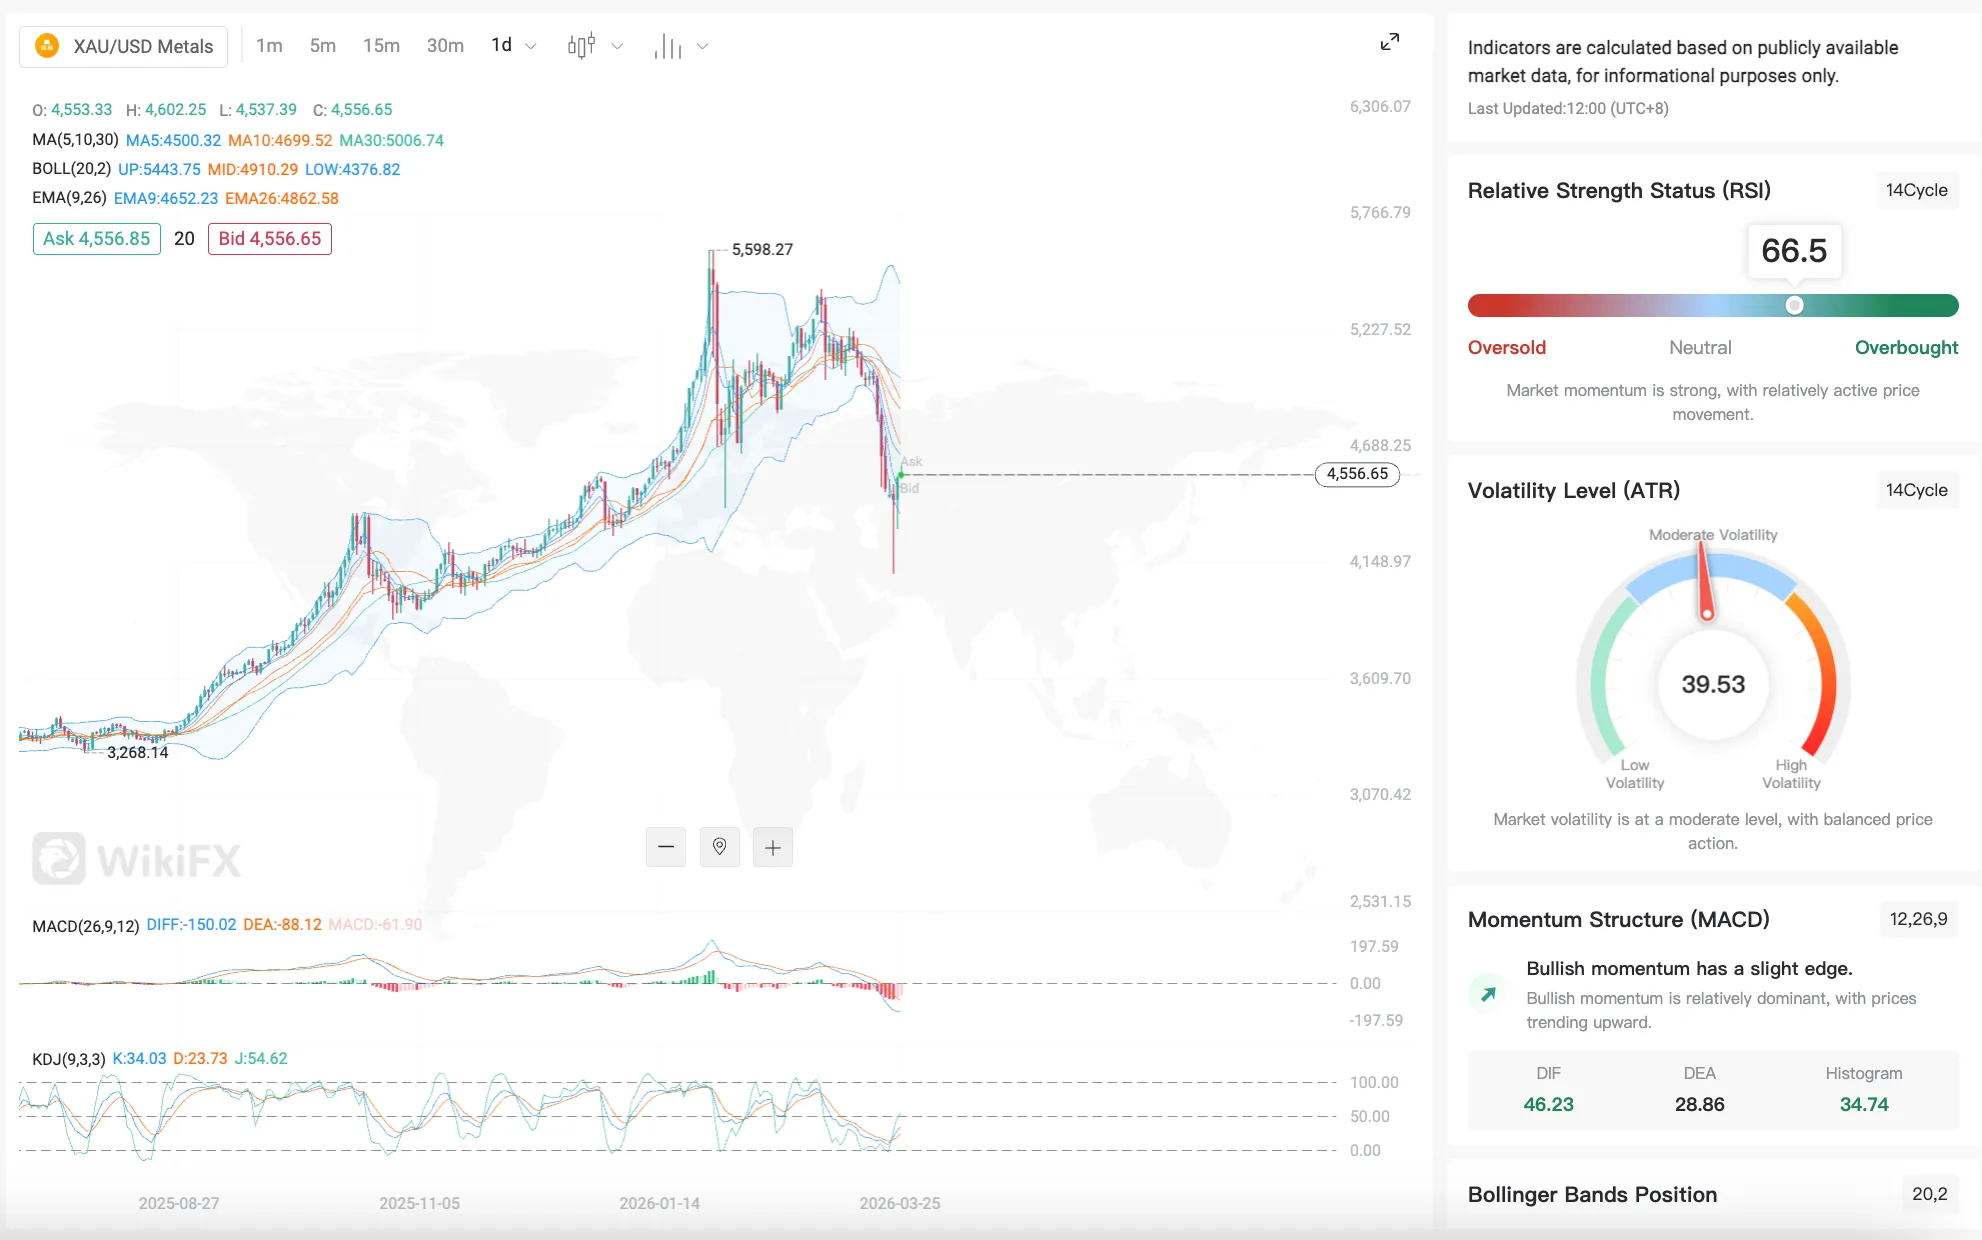
The break lower has shifted the short-term outlook. Momentum indicators point to continued selling pressure, even if the market may be approaching a zone where some corrective rebound becomes possible.
The RSI is moving lower and is nearing oversold territory, which suggests the selloff may be getting stretched in the near term. That does not automatically mean the trend is about to reverse, but it does leave room for short-lived rebounds if sellers begin to slow.
The ADX is also picking up, showing that volatility is expanding. That may not guarantee a clean directional move, but it does suggest the market has become more reactive and more unstable than it was during the earlier uptrend.
Key levels to watch
The first area to monitor on the upside is around 4,976, which aligns with the 50-period moving average and now acts as a key resistance zone. A recovery above that area would help stabilize the chart and reduce immediate bearish pressure.
Below that, 4,537 remains an important near-term reference point. It may act as a barrier during any rebound attempt, especially if the market tries to recover without stronger macro support.
On the downside, 4,300 stands out as the most important support. If that level gives way decisively, the recent decline would begin to look less like a correction and more like the start of a broader short-term bearish trend.
Final view
Gold is under pressure for reasons that are both macroeconomic and technical. Treasury yields are rising, the dollar is holding firm, and gold is no longer drawing the same immediate safe-haven demand that traders often expect during periods of weak confidence.
That does not rule out a short-term bounce, especially if oversold conditions trigger profit-taking from sellers. But for now, the broader setup still favors caution. Unless gold can reclaim key resistance levels, the latest decline may have further room to run.