Abstract:A losing streak can feel like proof that a set of rules has broken, when a short sample may simply be noisy. This guide explains sampling error, shows how to put a rough number on a normal win-rate swing, and lists the evidence mistakes beginners make during a drawdown period.
 Contents
What a drawdown period is really measuring
Most beginners meet a drawdown before they meet the arithmetic behind it. The account climbs for a while, then slides, and the question that follows is whether the rules stopped working or the market simply dealt a bad hand. A drawdown is the fall from a peak in your results to the next low, usually written as a percentage rather than as a sum of money.
It describes the shape of what has already happened. On its own it says nothing about whether the rules carry an edge, which is an advantage that only becomes visible across many trades. Three words get used loosely in these arguments, so it helps to keep them apart.
- A strategy is a fixed, written set of rules for entry, exit and position size, all settled before the first trade. Position size simply means how much currency you buy or sell in one trade.
- The sample is the number of closed trades you are judging.
- The drawdown period is the stretch in which results sit below their earlier peak.
Why a small sample swings so hard
Flip a fair coin four times and three heads is unremarkable. Flip it four times and three tails is equally unremarkable. Nobody watching four flips concludes the coin is bent, because everyone accepts that four flips carry almost no information about the coin itself.
Trading results follow the same arithmetic, though the intuition rarely comes with them. A run of ten trades feels like evidence, because each one involved money, screens and a decision. Statistically it sits much closer to those four coin flips.
Sampling error is the gap between what a short sample shows and what long-run behaviour would show. At ten trades that gap is wide enough to swallow the difference between a decent set of rules and a mediocre one. The law of large numbers is the plain statement that the gap narrows as the sample grows, an idea far older than any modern market.
Putting a number on the noise
The standard error of a win rate gives a rough size for that gap. Win rate means the share of trades that end profitable, written as a percentage. The formula below assumes each trade is independent of the others and that the true win rate stays the same throughout, so treat the result as a rough guide rather than an exact measurement.
Standard error = square root of [ p x (1 - p) / n ]
Here p is the long-run win rate as a decimal and n is the number of trades in the sample.
- Turn the win rate into a decimal, so 50% becomes 0.5.
- Multiply it by one minus itself: 0.5 x 0.5 = 0.25.
- Divide by the number of trades, giving 0.25 / n.
- Take the square root, then multiply by 100 to read the answer in percentage points, the unit used when comparing two percentages.
Run the same formula at four sample sizes, keeping the true win rate at 50%: about 11 percentage points at 20 trades, about 7 at 50, about 5 at 100, and about 3.5 at 200. A 20-trade run that wins only 40% of the time sits comfortably inside that first band.
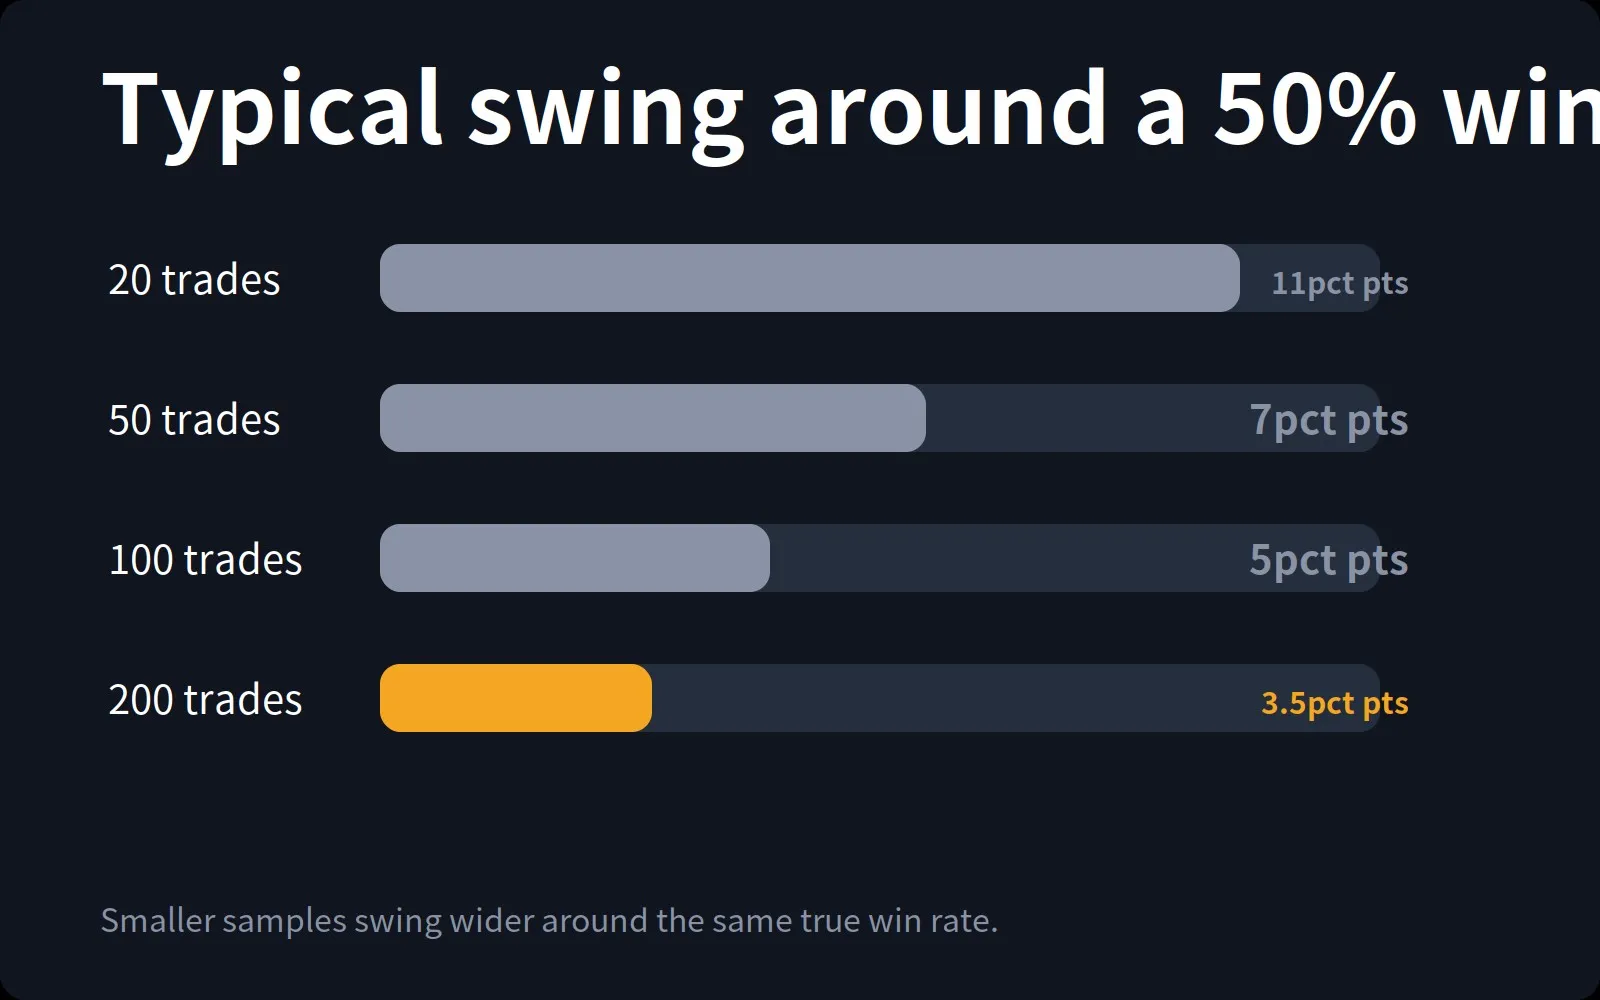
Standard error of a 50% win rate by sample size
Now a hypothetical case, offered purely as a teaching illustration and not as a recommendation or a claim about anyone's real system. Suppose the written rules win half of all trades, risk 20 pips on each trade, and hold 100,000 units of a pair whose quote currency is the US dollar. A pip is the smallest standard step in a currency quote, usually the fourth decimal place. On 100,000 units, one pip is worth roughly $10, so 20 pips is about $200 at risk per trade. Six losses in a row therefore costs about $1,200.
The chance of six straight losses, when each trade has a 50% chance of losing, is 0.5 multiplied by itself six times, about 1.6%. That sounds rare until you count the opportunities. A 100-trade sample contains roughly 95 overlapping six-trade windows, and a simple estimate puts the chance of meeting at least one such streak at about three in four. Because those windows overlap, treat that figure as an approximation rather than a precise probability.
Where beginners misread the evidence
- Judging after a handful of trades. At 10 trades the standard error around a 50% win rate is close to 16 percentage points, so almost anything from the mid 30s to the mid 60s is ordinary noise.
- Changing rules in the middle of a drawdown. Every edit starts a fresh sample, so rules revised four times in one bad month leave four tiny samples instead of one usable one.
- Comparing money drawdowns across account or position sizes. A $1,200 fall means something different on different balances; percentages travel between accounts, raw amounts do not.
- Treating a backtest as the same evidence as live trades. A backtest replays fixed rules over historical prices and may hold hundreds of trades, while the live record holds fifteen. The two are different kinds of measurement, and blending them makes the thin one look stronger than it is.
- Using "the market has changed" as a conclusion. It may even be true, but announced during a six-trade losing streak it is a story rather than a measurement.
The arithmetic sizes the noise around a result. It does not certify an edge, and it never says what to do next.
A drawdown inside the expected band is not a green light, and one outside it is not a verdict. Both are prompts to check whether the rules were actually followed and whether the sample is large enough to argue about at all.
The formula answers one narrow question: could chance alone have produced these results? Everything past that point is judgement, and judgement is where record keeping matters more than arithmetic.