Abstract:Expected value and the Kelly formula can make a trading model look precise. This beginner guide explains what each one actually calculates, walks through a clearly labelled hypothetical example, and shows why assumptions, costs and estimation error limit what the numbers can prove.
Expected value and the Kelly criterion turn up in almost every trading course, usually with a spreadsheet attached. The sheet returns a positive number and a tidy percentage, and both look like answers. Neither is a forecast. Both describe a model, and a model is only as trustworthy as the assumptions underneath it.
 Contents
What Expected Value Really Adds Up
Expected value, usually shortened to EV, is the probability-weighted average result of repeating the same decision under the same conditions. When the number is positive, traders say the decision has an edge, meaning a modelled advantage per repetition. In a simple win-or-lose version the formula is EV = (p × gain) - (q × loss), where p is the estimated chance of a win, q the estimated chance of a loss, and p + q = 1. Gain and loss must share a unit, whether pips (the standard unit for a currency pair's price change) or account currency.
The answer is only as good as the inputs. A win rate, meaning the share of trades that end in profit, measured over 20 trades is a rough estimate rather than a fixed law of the market. Leave out the spread (the gap between the buy and sell price), the commission (the broker's fee per trade) or slippage (the difference between the price expected and the price actually filled), and the figure flatters you.
A positive EV can still sit inside a losing month, and a negative EV inside a winning one. That scatter is variance, the natural spread of outcomes around an average. It explains how a reasonable model and a bad stretch can exist at the same time.
Where Kelly Comes In
The Kelly criterion takes the same ingredients and answers a different question. If the edge were real and repeatable, what share of capital would produce the fastest long-run compound growth, meaning growth that builds on the balance left after each repetition? One common form is f = (b × p - q) / b.
Here b is the reward-to-risk ratio (the gain divided by the loss), q is 1 - p, and f is the fraction of the trading balance put at risk on one repetition. At risk means the amount lost if the stop is hit, where the stop is the preset exit that closes a losing position; it is not the full position value. When the formula returns a negative f, the model is saying the assumed edge does not support staking anything.
Kelly is a sizing rule, not a signal. It says nothing about whether a pair will rise or fall, and it does not choose an entry time or a market. Nor can it turn a guess about p into a fact. The formula looks exact while its most important input stays uncertain.
A Hypothetical Calculation
Everything below is a hypothetical teaching demonstration with no direction implied, and it is not a trade idea, a recommendation or an instruction to enter anything. The setup risks 30 pips to seek 50 pips, assumes a win probability of 0.40, and ignores costs. No market price is needed, because the whole calculation sits in pips.
EV = (0.40 × 50) - (0.60 × 30) = 20 - 18 = +2 pips per repetition. Across 100 independent repetitions, where one result does not change the next probability, the model expects 40 wins × 50 = 2000 pips and 60 losses × 30 = 1800 pips, for a net of +200 pips. A real sequence can still contain long losing runs, and 100 repetitions is a small sample with plenty of room for that.
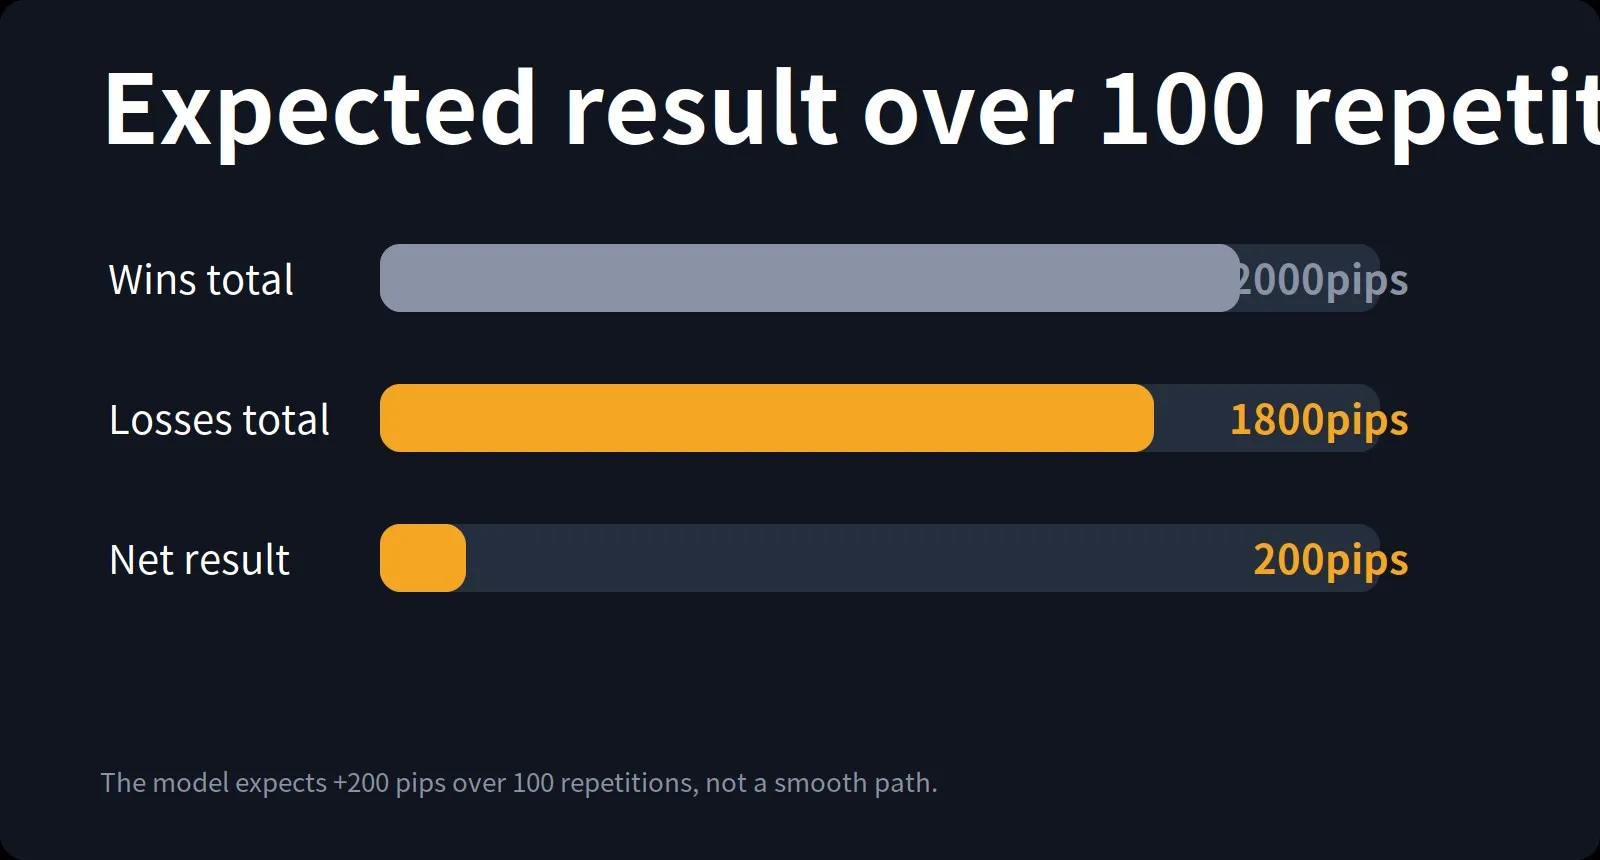
Hypothetical 100 repetitions; costs ignored.
The same inputs feed Kelly: b = 50 / 30 = 1.667, so f = (1.667 × 0.40 - 0.60) / 1.667 = 0.04, or 4%. In the model, 4% of capital per repetition is the full Kelly fraction. That output is not a safety certificate. It is simply what the formula returns when p is treated as known.
What the Maths Cannot See
Several assumptions sit behind that 4%, and when one of them fails the number tends to fail with it. The list below is an audit, not a set of technicalities.
- Known probabilities. In a simple game the rules can fix p. In forex it has to be estimated from a market that keeps changing, and a small error moves f a long way. Lower the assumed win probability in the example above from 0.40 to 0.30 and the same formula returns about -0.12, which the model reads as no stake at all.
- Independence. The simple formula treats each repetition as separate. Real positions can overlap, move together and be hit by the same news release, so the effective number of independent bets is smaller than it looks.
- Fixed payoffs. A stop can slip, a spread can widen, and a weekend gap can turn a 30 pip risk into a larger loss.
- Account mechanics. Margin, the collateral a broker requires you to set aside in order to open and hold a position, and minimum lot sizes (the smallest trade size a broker allows) are set by the broker, not by the formula, and can insist on a size the maths never asked for. Stop-out levels, where a broker closes positions automatically, also differ between brokers, so no single rule travels everywhere.
- Drawdown. The formula models growth, not the experience of a deep drawdown, meaning the fall from a peak balance to a later low. That fall is a lived constraint on staying in the market, and it never appears in the equation.
- Costs. Spread, commission, slippage, funding (the interest charged or credited for holding a position overnight) and currency conversion all shift EV and the Kelly fraction. They are not cosmetic.
The most common beginner error is to treat f as a fact because it arrives with two decimal places. The maths is more useful as an audit tool. EV shows whether a set of assumptions is internally consistent, and Kelly translates those same assumptions into a fraction, so varying p or b makes the sensitivity visible.
Read together, they describe a model and its sizing output, not the market. Neither tells you where price will go, and neither removes the chance of being wrong.