World Cup Fever Is Here! Choose your broker like you choose your team
Join WikiFX and investors worldwide in celebrating the excitement of the 2026 FIFA World Cup!
Original
简体中文
繁體中文
English
Pусский
日本語
ภาษาไทย
Tiếng Việt
Bahasa Indonesia
Español
हिन्दी
Filippiiniläinen
Français
Deutsch
Português
Türkçe
한국어
العربية
اردو

Abstract:In addition to fundamental analysis, technical analysis is also a main approach to speculating or investing in the Forex markets.

Forex traders often debate which of these two types of analysis is better. In fact, both technical and fundamental analysis are required if you want to understand the full scope of the markets that you are trading.
In this article, we will focus on technical analysis and tell you about the difference between technical analysis and fundamental analysis.
What Is Technical Analysis in Forex?
Technical analysis is the study of historical price action in order to identify patterns and determine probabilities of future movements in the market. Technical analysis of the financial markets have existed for as long as there have been markets driven by supply and demand.
First introduced by Charles Dow and the Dow Theory in the late 1800s, technical analysis has evolved to included hundreds of patterns and signals developed through years of research.
There are three assumptions that have continued to form the framework for technical analysis trading: the market discounts everything; price moves in trends; history tends to repeat itself.
Technical analysis can be used on any security with historical trading data, including stocks, futures, commodities, fixed-income, currencies, and other securities.
In fact, technical analysis is far more prevalent in commodities and forex markets where traders focus on short-term price movements.
How To Use Technical Analysis In Forex Markets?
As mentioned above, technical analysis is basically the study of an asset's current and previous prices, which is a reflection of the opposing selling and buying forces, and these forces are closely related to the emotions of traders and investors.
There are many ways to identify patterns in the financial markets, including the use of technical studies, indicators, and other analysis tools.
Traders use a variety of charting tools known as indicators to identify existing trends and predict trends that may emerge in the future. Since technical analysis indicators are fallible, some traders make use of multiple indicators as a way to reduce risks.
1. Price Chart Analysis
The price chart shows the value of two currencies conversion and keeps fluctuating from time to time. There are three models of price charts which are generally used in technical analysis: Line Chart, Bar Chart, and Candlestick Chart.
2. Technical Indicators
Traders always use a variety of different indicators and metrics to try and determine market trends, based on charts and historical price action. There are many kinds of technical indicators, even until hundreds, making every trader can use the different indicators.
The indicators that are most generally used and well-known are Moving Average (MA) and Relative Strength Index (RSI).
The MA contains simple moving averages (SMA), which is calculated based on the closing prices of an asset within a set time period, and a modified version of the SMA exponential moving average (EMA).
The RSA is a momentum oscillator that measures the speed and change of price movements. The RSI oscillates between zero and 100.
There are many other technical indicators including moving average convergence divergence (MACD), the Bollinger Bands (BB) indicator, the Stochastic RSI and so on.
3. Support & Resistance Levels
Spotting the trend of an asset's price is the principal objective of technical analysis, and trendlines can help determine potential areas where the trend might be reversing. Support and resistance levels are essential to determine the trend of an asset. They also represent levels where prices could reverse to start a new trend, or a new movement in the main trend.
What Are The Differences Between Technical Analysis & Fundamental Analysis?
Technical analysis helps in determining more accurate entry and exit points over the short-term, while fundamental analysis is more of a long-term approach and helps explain the reason of a price move.
Unlike fundamental traders, a technical trader is not as concerned about why something is moving because the trends and patterns on the charts are their signals. Getting started in technical analysis can be done quickly by assessing the direction and strength of trends.
Therefore, while two methods are essential, most traders these days focus mainly on technical analysis. But there are certainly times when technical analysis can fail. One of the reasons behind this is the fact that the markets are adjusting to the news.
In order to make technical analysis work for you, traders need to have a full understanding of the markets which includes using both fundamental and technical analysis.

Disclaimer:
The views in this article only represent the author's personal views, and do not constitute investment advice on this platform. This platform does not guarantee the accuracy, completeness and timeliness of the information in the article, and will not be liable for any loss caused by the use of or reliance on the information in the article.

Join WikiFX and investors worldwide in celebrating the excitement of the 2026 FIFA World Cup!
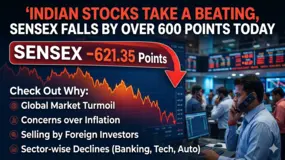
Indian stock markets witnessed a sharp low in the early trading hours on Monday. While the Sensex fell by more than 600 points, Nifty slumped under 23,200. The fall in the stock market today is the investors’ reaction to the escalating tensions in the Middle East, a surge in crude oil prices and weakness across markets worldwide. At around 9:30 a.m. on June 8, 2026, the BSE Sensex dropped by 627.47 points to 73,615.87, recording a fall of 0.85%. At the same time, the Nifty declined by 195.40 points to 23,171.30, registering a 0.84% fall. The selloff was broad based, with most sectoral indices slipping into red. Nifty IT, Nifty Realty, Nifty Auto and Nifty Metal slipped by 1.61%, 1.68%, 1.21% and 1.31%, respectively. Even the Nifty Midcap 100 and Nifty Smallcap 100 declined by 0.73% and 0.63%, respectively. As far as Sensex stocks are concerned, only State Bank of India, Axis Bank, Power Grid Corporation of India and Sun Pharmaceutical Industries were found to be green. Among the one

Singapore authorities have concluded a major anti-scam enforcement operation that resulted in 221 individuals being placed under investigation for their alleged roles in a wide range of fraudulent schemes.
Have you experienced issues with Pepperstone deposit & withdrawal processing? From your experience, do you feel that the Australia-based forex broker causes losses to its clients? Did the brokerage entity freeze your account and give you a margin call? All these trading allegations have been rampant on broker review platforms such as WikiFX. This Pepperstone review article takes a close look at the user complaints, especially in 2026. Additionally, we have given an overview of the regulatory framework under which the brokerage entity operates.
 WikiFXWikiFXWikiFXWikiFXWikiFXWikiFXWikiFXWikiFXWikiFXWikiFX
