Abstract:FRIDAYS MARKET RECAP – NASDAQ 100, WORST MONTH SINCE 2008, US SPENDING, US DOLLAR, YEN
Nasdaq 100 sank on Friday, seeing worst month since the 2008 financial crisis
Anti-risk Japanese Yen received a break as traders flocked to its safety in droves
More turmoil to come before the Fed? Keep an eye on Caixin Chinese PMI data
Aggressive risk aversion plagued the last trading day of the week on Wall Street. On Friday, futures tracking the Nasdaq 100, Dow Jones and S&P 500 declined 4.48%, 2.8% and 3.64% respectively. In fact, April was the worst month for the Nasdaq 100 since October 2008, back when the global financial crisis wreaked havoc on financial markets. You would have been lucky to find a sector that didnt underperform.
So, what likely dented risk appetite? One could point to another round of solid US inflation-adjusted consumer spending data. Real personal spending rose 0.2% in March versus -0.1% anticipated. This was primarily boosted by services, rather than merchandise purchases, a sign of reversion back to pre-pandemic trends. Treasury yields surged across maturity spectrums, underscoring hawkish Fed bets.
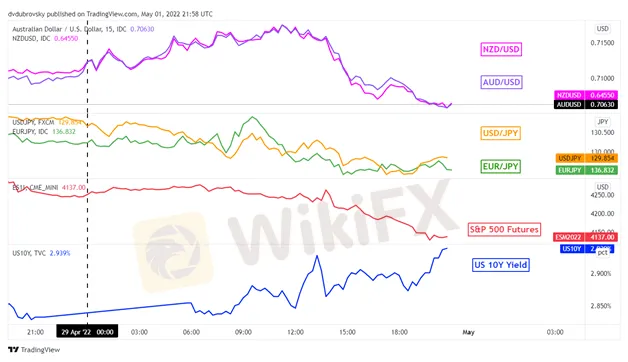
In fact, the odds of a 75-basis point rate hike from the central bank in June climbed. On the chart below, you can clearly see the impact on markets. The US Dollar gained against the sentiment-linked Australian and New Zealand Dollars. This is as the anti-risk Japanese Yen capitalized on worrisome investors, finally catching a break from persistent destruction, recently amplified by a still-dovish Bank of Japan.
KEY MARKET PERFORMANCE LAST FRIDAY – WALL STREET MELTDOWN
NASDAQ 100 TECHNICAL ANALYSIS
Where does this leave the Nasdaq 100? On the 4-hour chart below, the index seemed to reinforce the 12801 – 12942 support zone. A breakout under this range exposes lows from March 2021. Still, positive RSI divergence does show that downside momentum is fading. That can hint at a turning point to come. Above, keep a close eye on the 50- and 100-period Simple Moving Averages for resistance.
NASDAQ 100 4-HOUR CHART

MONDAYS ASIA PACIFIC TRADING SESSION – RISK AVERSION TO CONTINUE? WATCH THE YEN AND YUAN
At the Asia-Pacific market open, the anti-risk Japanese Yen weakened as S&P 500 futures turned higher. This could perhaps be a sign of bears taking profit. Still, the proximity of the Federal Reserve rate decision could make it difficult for markets to fund sustainable upside momentum. As such, perhaps this may offer the Japanese currency some breathing space in the interim.
Over the weekend, China released April PMI data. Manufacturing figures clocked in at 47.4 against the 47.3 estimate. Readings below 50 indicate shrinking activity. While that was better than expected, non-manufacturing shrank to 41.9 against the 46.0 estimate. This is a clear sign of the governments Covid-zero policy denting economic activity, which has been increasingly associated with a weaker Yuan. Private surveys of equivalent Chinese activity will cross the wires later in the session.
USD/JPY TECHNICAL ANALYSIS
On the daily chart, USD/JPY was unable to hold a push above the 78.6% Fibonacci extension at 130.42 this past Friday. It stands as key immediate resistance. Negative RSI divergence does show that upside momentum is fading. This can precede a turn lower, placing the focus on the rising trendline from March. Closing under the trendline may open the door to a meaningful turn lower. Otherwise, clearing resistance will bring USD/JPY closer to the 2002 peak at 135.16.