
Globale Broker-Regulierungsanfrage-App
WikiFX
Deutsch
简体中文
繁體中文
English
Pусский
日本語
ภาษาไทย
Tiếng Việt
Bahasa Indonesia
Español
हिन्दी
Filippiiniläinen
Français
Deutsch
Português
Türkçe
한국어
العربية
Epic Sell-Off in Precious Metals
Zusammenfassung:The precious metals market has entered an epic liquidation phase. Silver experienced a violent intraday reversal, plunging 36% from its peak, while gold suffered a single-day drop of 10%. Cryptocurren
The precious metals market has entered an epic liquidation phase. Silver experienced a violent intraday reversal, plunging 36% from its peak, while gold suffered a single-day drop of 10%. Cryptocurrencies also joined the sell-off. Importantly, this decline does not yet appear to be over.
The magnitude of the move reflects a sharp retreat in speculative sentiment toward paper gold and cryptocurrencies. Even long-term holders chose to take profits during the crash, creating a classic capital rotation dynamic in which long-term positions liquidated into short-term traders, intensifying downside pressure.
Diverging Market Views on the Outlook for Precious Metals
Market sentiment has now polarized into two extreme camps. One side views the correction as a buying opportunity, maintaining a bullish stance rooted in de-dollarization, geopolitical risk, and inflation hedging. The opposing view argues that the current collapse marks a structural peak, suggesting that precious metals may fail to reclaim their former highs for the next decade, entering a prolonged period of underperformance.
Gold Fundamentals: A Broken Relationship
From a fundamental perspective, as early as 2024, we observed that traditional macroeconomic drivers of gold pricing had largely lost their explanatory power. In particular, the historical correlation between U.S. real interest rates and gold prices has broken down, rendering conventional valuation frameworks ineffective.
")
(Figure 1: U.S. Real Interest Rates vs. Gold Prices | Source: MacroMicro)
Given our analytical framework, which emphasizes monetary policy and macroeconomic data, we have long refrained from making fundamental price projections for gold. Instead, we rely primarily on technical analysis, adopting a price-differential driven, highly disciplined trading approach. As a result, gold trading opportunities have been relatively limited over the past two years.
No Need to Predict the Bottom
In light of the current sharp sell-off, we remain skeptical of any near-term price forecasts. The scale of the correction speaks for itself. Investors should recognize this move as a mean reversion following two years of elevated prices, rather than overanalyzing short-term narratives.
Going forward, our focus will be on whether gold re-establishes a meaningful linkage with U.S. real yields. Meanwhile, the synchronized collapse in precious metals and cryptocurrencies has reignited the classic “cash is king” mindset. As risk assets are indiscriminately sold, this environment may present more attractive medium-term entry opportunities.
Market Sentiment and Cash Preference
Despite the Fear & Greed Index remaining in the Greed zone, broad-based asset declines alongside a stabilizing and strengthening U.S. dollar underscore investors growing preference for holding cash while reassessing risk.
")
(Figure 2: Fear & Greed Index | Source: CNN)Institutional Positioning: Gold as a Crowded Trade
The January Bank of America Fund Manager Survey (FMS) delivered an early warning by identifying gold as a crowded trade. Notably, even as cash allocations fell to 3.2%, a historical low, managers paradoxically cited cash holdings as the largest perceived risk. The prevailing consensus suggests that the next phase will be driven by sector rotation rather than a prolonged “cash-only” regime.
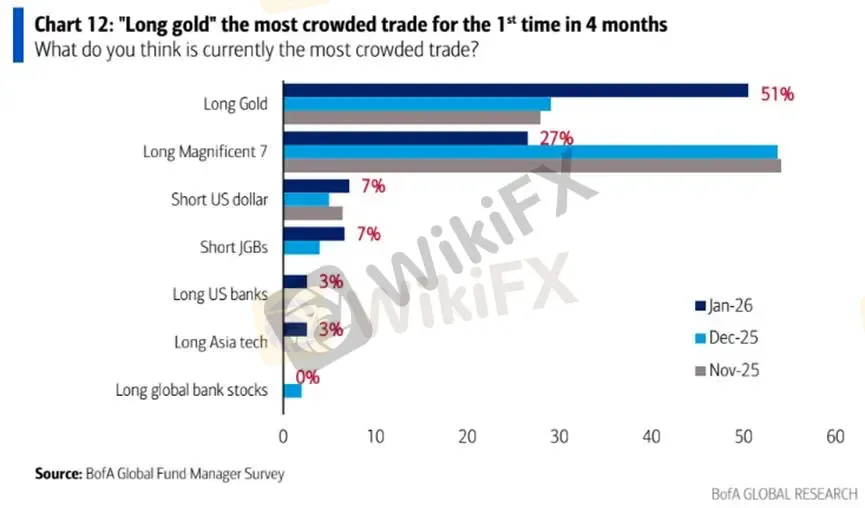
(Figure 3: Over Half of Fund Managers View Long Gold Positions as Crowded | Source: Bank of America)
Technical Analysis of Gold
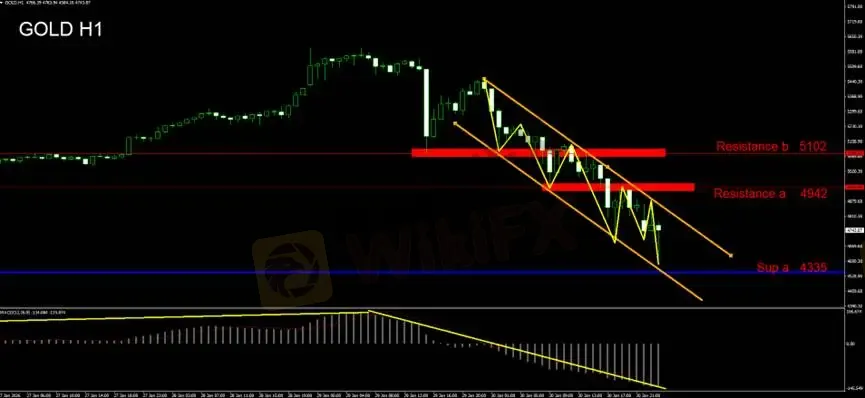
Gold volatility has intensified, yet price action continues to follow a clear technical structure. The current downtrend is oscillating within a declining channel (orange). From a trading perspective, the upper boundary of the channel serves as a key resistance zone. Failed breakouts can be used to initiate short positions, with profit targets set near the lower boundary of the channel.
Investors should avoid relying on psychological round-number support or resistance levels. Approximately 65% of gold trading volume is algorithm-driven, making headline-driven trading strategies unreliable. Technical signals should remain the primary reference.
The MACD, as a short-term oscillating indicator, currently offers limited actionable insight. Its sustained expansion below the zero line confirms that bearish momentum remains dominant. Based on historical behavior, the market is likely to enter a phase of low-level consolidation with bearish bias.
Given the evident erosion of bullish confidence, investors should maintain a short-biased strategy. Attempting to capture countertrend rebounds carries a low probability of success and should be avoided.
Key Levels
Support
Sup A: 4335
Resistance
Resistance A: 4942
Resistance B: 5102
Risk Disclosure
The views, analyses, research, price levels, and other information provided above are for general market commentary only and do not represent the position of this platform. All readers bear full responsibility for their investment decisions. Please trade with caution.
Haftungsausschluss:
Die Ansichten in diesem Artikel stellen nur die persönlichen Ansichten des Autors dar und stellen keine Anlageberatung der Plattform dar. Diese Plattform übernimmt keine Garantie für die Richtigkeit, Vollständigkeit und Aktualität der Artikelinformationen und haftet auch nicht für Verluste, die durch die Nutzung oder das Vertrauen der Artikelinformationen verursacht werden.
WikiFX-Broker
Aktuelle Nachrichten
(CFD und Forex) – was ist besser für dich?
 WikiFX
Warum du Prop Firms Brokern vorziehen solltest
WikiFXForex News Trading: Welche Risiken gibt es?
WikiFXWusstest du, dass du deine eigene Forex-Trading-Strategie erstellen kannst?
WikiFXWechselkursberechnung
USD

CNY
Aktueller Wechselkurs:0
Bitte geben Sie den Betrag ein
USD
Konvertierbarer Betrag
CNY
Berechnen