
Broker Globale Piattaforma di Verifica Regolamentare
WikiFX
English
简体中文
繁體中文
English
Pусский
日本語
ภาษาไทย
Tiếng Việt
Bahasa Indonesia
Español
हिन्दी
Filippiiniläinen
Français
Deutsch
Português
Türkçe
한국어
العربية
DBG Markets | Support & Resistance: The Cornerstone of Technical Analysis Part 1
Sommario:Support Resistance: The Cornerstone of Technical AnalysisSupport and resistance are among the most fundamental concepts in technical analysis — and a must-learn for anyone entering the world of tradi

Support & Resistance: The Cornerstone of Technical Analysis
Support and resistance are among the most fundamental concepts in technical analysis — and a must-learn for anyone entering the world of trading. They are simple to understand, yet play a critical role in identifying potential market turning points.
In the following article, DBG Markets will cover the most essential principles and practical applications of support and resistance to help you sharpen your trading edge.
1. Overview of Support & Resistance
Support and resistance, refer to the two relative concepts of support line and resistance line, which are also the basis of technical analysis. Support and resistance lines can be either straight or diagonal:
· When the price falls to the support line, there is a greater probability of being supported and rising;
· When the price rises to the resistance line, there is a higher probability of being pressured and falling.
Many technical analysis indicators and tools are designed to find support and resistance, use them to confirm entry and exit trade opportunities, and here is how we can interpret the concept of “Support & Resistance”:
Bulls (Buyer)Bears (Seller)Support LevelBuying Opportunities at low PriceLevel to set stop-loss orderResistance LevelLevel to set stop-loss orderSelling opportunities at high price
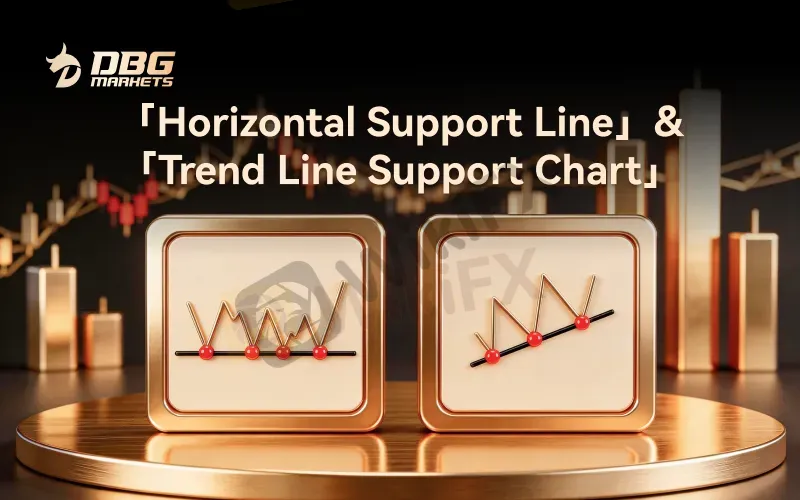
1.1 The Support Level
The support line is usually a horizontal or upward-sloping straight line. When the price falls and touches the support line, it often receives support and rises.
All technical analysis methods are similar, so important support lines are simultaneously monitored and applied in trading strategies by many investors. The support line is effective because:
· Bulls seek opportunities to buy on dips at the support line, which increases buying power;
· Bears set stop-loss orders based on the support line. When the stop-loss is triggered, they need to buy to close their positions, further increasing buying power.
The combination of these two buying powers increases the likelihood of the market price holding steady at the support line.
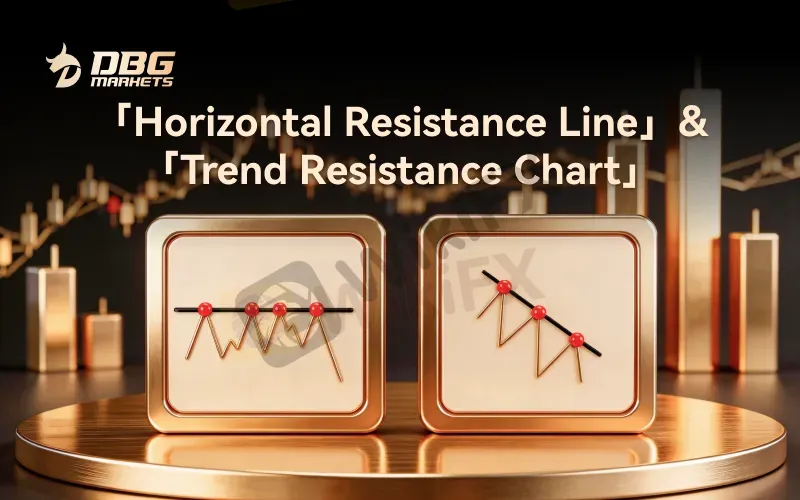
1.2 The Resistance Level
The resistance line, also known as the "ceiling," is usually a horizontal or downward-sloping straight line. When the price rises and touches the resistance line, it often faces resistance and falls.
Important resistance lines are also monitored and applied in trading strategies by many investors. The principle of the resistance line is:
1. Bears seek opportunities to sell on rallies at the resistance line, which increases selling power;
2. Bulls set stop-loss orders based on the resistance line. When the stop-loss is triggered, they need to sell to close their positions, further increasing selling power.
The combination of these two selling powers increases the likelihood of the market price being hindered at the resistance line.
2. How to Identify Support & Resistance?
Identifying support and resistance levels is often one of the first skills beginners learn in trading, as the concept is relatively straightforward and easy to grasp.
Using the advanced charting tools available on the DBG Markets MT5 platform, traders utilize various techniques to spot these levels. Some of the most common methods include:
Previous price highs or lows
Previous price highs often become future resistance levels, while previous price lows often become future support levels.
Round number price levels
Round number price levels can have an impact on traders' psychology, and therefore are often important support and resistance levels.
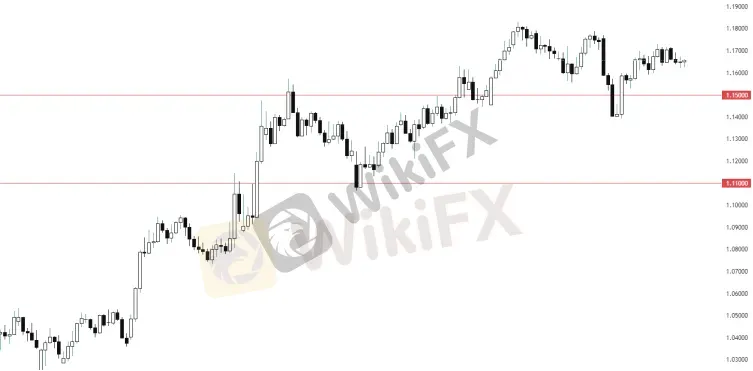
For example, in EURUSD, the round numbers 1.1100 and 1.1500 served as critical support and resistance levels during its uptrend rally at that time.
Trend Lines
A trend line is a line connecting two high or low points in a trend, forming a diagonal line. Support and resistance levels often appear on trend lines.
Fibonacci retracement lines
The Fibonacci sequence is also applicable to financial trading. When the market retraces, support and resistance levels often form at the 38.2%, 50.0%, and 61.8% retracement ratios.
Although support and resistance may seem simple and easy to learn, they remain one of the most powerful tools in trading. In fact, many times the simplest methods prove to be the most effective.

Disclaimer:
Le opinioni di questo articolo rappresentano solo le opinioni personali dell’autore e non costituiscono consulenza in materia di investimenti per questa piattaforma. La piattaforma non garantisce l’accuratezza, la completezza e la tempestività delle informazioni relative all’articolo, né è responsabile delle perdite causate dall’uso o dall’affidamento delle informazioni relative all’articolo.
WikiFX Trader
VT Markets
Sotto supervisione
D prime
Supervisione del paese
GTCFX
Sotto supervisione
GO Markets
Sotto supervisione
IC Markets Global
Sotto supervisione
XM
Sotto supervisione
VT Markets
Sotto supervisione
D prime
Supervisione del paese
GTCFX
Sotto supervisione
GO Markets
Sotto supervisione
IC Markets Global
Sotto supervisione
XM
Sotto supervisione
Rate Calc
USD

CNY
Tasso di cambio attuale:0
inserisci l'importo
USD
A disposizione
CNY
Calcolare 