
Broker Globale Piattaforma di Verifica Regolamentare
WikiFX
English
简体中文
繁體中文
English
Pусский
日本語
ภาษาไทย
Tiếng Việt
Bahasa Indonesia
Español
हिन्दी
Filippiiniläinen
Français
Deutsch
Português
Türkçe
한국어
العربية
DBG Markets | Support & Resistance: The Cornerstone of Technical Analysis Part 2
Sommario:3. Support and Resistance - Breakouts and TransformationsSupport and resistance serve as key reference levels where price often rebounds. However, they are not permanent. These levels can be broken, a
3. Support and Resistance - Breakouts and Transformations
Support and resistance serve as key reference levels where price often rebounds. However, they are not permanent. These levels can be broken, and when that happens, they dont simply lose their significance. In many cases, a breakout leads to a transformation where support becomes resistance, and resistance becomes support.
As trends evolve, support and resistance levels are eventually breached. Once a breakout occurs, it often signals a shift in market structure, creating new levels that traders can use as reference for future price action.
· When the support line is broken downwards, the market will enter a downtrend or consolidation, and the broken support line will transform into a future resistance line;
· When the resistance line is broken downwards, the market will enter an uptrend or consolidation, and the broken resistance line will transform into a future support line.
Take the XAU/USD (Gold) chart as an example. The red-marked area highlights a key resistance level where prices previously struggled to break through. Once the breakout occurred, this resistance flipped into a new support level, as shown by the blue mark.
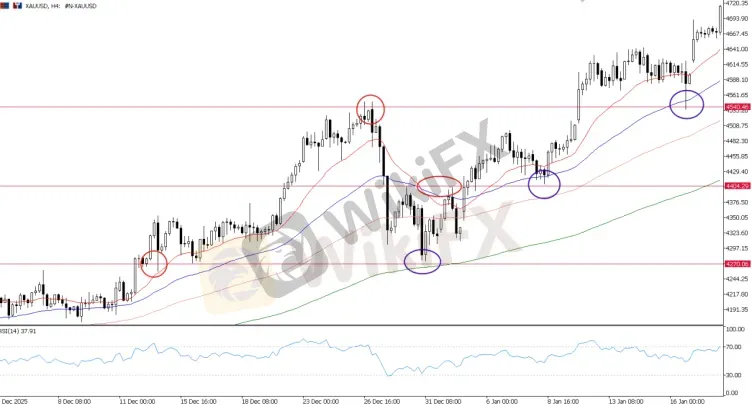
This shift illustrates the classic principle of technical analysis: once broken, resistance often turns into support, reinforcing the validity of the breakout and providing traders with a potential entry zone.
4. Importance of Support & Resistance Level
Support & Resistance can be seen as a fundamental of a technical analysis and one of the most important analytical tools in trading, because they can help traders in a few ways:
1. Identifying potential entry and exit points: Traders can use support and resistance levels to identify potential entry points for buying or selling, as well as exit points for taking profits or cutting losses.
2. Setting stop-loss orders: Traders can use support and resistance levels to set stop-loss orders to protect their positions in case the market moves against them.
3. Assessing market sentiment: Support and resistance levels can help traders assess the overall sentiment of the market. If a security repeatedly bounces off a support level, it may indicate that the market is bullish on that security. Conversely, if a security repeatedly hits a resistance level and fails to break through, it may indicate that the market is bearish on that security.
4. Developing trading strategies: Traders can develop trading strategies based on support and resistance levels, such as buying when a security hits a support level or selling when it hits a resistance level.
5. Final Thoughts on Support & Resistance
Support and resistance are more than just lines drawn on a chart — they represent the collective psychology, fear, and greed of buyers and sellers in the market. By identifying these levels, traders can anticipate potential turning points, plan their entries and exits more effectively, and drastically improve their overall decision-making.
However, its important to remember that support and resistance are not absolute. Price can and often does break through these boundaries. This is why combining these levels with other technical indicators, fundamental market context, and strict risk management is crucial for long-term survival.
For new traders, mastering support and resistance should be the very first step in building a robust technical foundation. With practice, discipline, and the right broker, these levels will become a reliable map for navigating the financial markets.
Ready to put theory into practice? Test your support and resistance strategies on a risk-free demo account, or dive into the live markets with DBG Markets today.

Disclaimer:
Le opinioni di questo articolo rappresentano solo le opinioni personali dell’autore e non costituiscono consulenza in materia di investimenti per questa piattaforma. La piattaforma non garantisce l’accuratezza, la completezza e la tempestività delle informazioni relative all’articolo, né è responsabile delle perdite causate dall’uso o dall’affidamento delle informazioni relative all’articolo.
WikiFX Trader
VT Markets
Sotto supervisione
TMGM
Sotto supervisione
IC Markets Global
Sotto supervisione
FXCM
Sotto supervisione
GO Markets
Sotto supervisione
AVATRADE
Sotto supervisione
VT Markets
Sotto supervisione
TMGM
Sotto supervisione
IC Markets Global
Sotto supervisione
FXCM
Sotto supervisione
GO Markets
Sotto supervisione
AVATRADE
Sotto supervisione
Rate Calc
USD

CNY
Tasso di cambio attuale:0
inserisci l'importo
USD
A disposizione
CNY
Calcolare 