简体中文
繁體中文
English
Pусский
日本語
ภาษาไทย
Tiếng Việt
Bahasa Indonesia
Español
हिन्दी
Filippiiniläinen
Français
Deutsch
Português
Türkçe
한국어
العربية
BofA Global Fund Manager Survey – November: Cash Shortage and Capex Frenzy
Sommario:The November 2025 Bank of America Global Fund Manager Survey (FMS) is summarized with the subtitle:“Cash poor, capex rich, rate-cut needy.”This description captures the current market backdrop highlig
The November 2025 Bank of America Global Fund Manager Survey (FMS) is summarized with the subtitle:
“Cash poor, capex rich, rate-cut needy.”
This description captures the current market backdrop highlighted in the report.
On one hand, market sentiment has risen to its most optimistic level since February 2025, with global growth expectations turning positive.
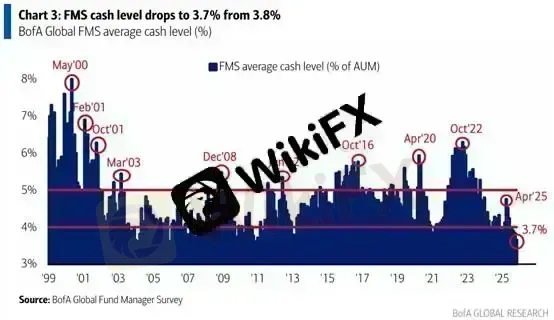
On the other hand, cash balances have dropped to dangerously low levels, triggering BofAs internal “Sell Signal.” Average cash allocation now stands at just 3.7%.

(Figure 1: FMS Fund Manager Cash Levels — Source: BofA)
A closer look at FMS positioning shows significant capital rotation across asset classes.
But comparing these allocations with their historical Z-Scores reveals fund managers true sentiment.
Absolute weights suggest investors are chasing risk, yet Z-Score positioning—measured against 20-year historical averages—indicates that managers are actually building a form of “hidden defensive positioning.”

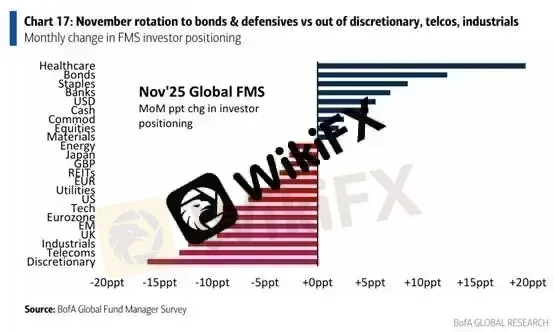
(Figure 2: Month-over-Month Positioning Changes in November — Source: BofA)
In November, fund flows showed strong rotation into defensive areas:
Healthcare: Net overweight surged +20ppts to +40%, the highest since December 2022.
Banks: Net overweight climbed to +36%, the strongest since December 2024.
Bonds and Staples: Both saw notable inflows as investors moved capital into defensive assets.
The major areas of reduction included:
Consumer Discretionary: A record single-month cut of –16ppts, now –23% net underweight, the lowest since December 2022—signaling severe pessimism toward consumer spending.
Technology: Largest reduction in eight months; net overweight fell to 9%.
UK Equities: The sharpest reduction since October 2022.
Investors are aggressively cutting cash (a bullish signal) while simultaneously piling into utilities and healthcare—classic defensive sectors—out of fear of downside risks.
This is not a typical offensive bull-market stance; rather, it resembles a “defensive long” posture amid elevated valuations, consistent with the positioning seen in the October FMS survey.

(Figure 3: Z-Score Positioning Across Asset Classes — Source: BofA)
The survey also shows an unusually strong long-term bullish consensus on gold prices among fund managers.
Core consensus range ($4,000–$5,000/oz):
A total of 61% expect gold to trade between $4,000 and $5,000 per ounce by the end of 2026:
34% expect $4,000–$4,500
27% expect $4,500–$5,000

(Figure 4: Fund Managers Long-Term Gold Outlook — Source: BofA)
Gold Technical Analysis

Gold has rebounded for two consecutive sessions, testing the Fibonacci neutral-zone resistance near $4,132.
From a technical perspective, the broader downtrend remains intact, and trading strategies should continue to favor short-biased setups.
The key intraday support sits at $3,997; a breakdown below this level would reinforce bearish momentum.
For a broader swing-leg decline, traders should watch for a bearish engulfing pattern on the daily candle formation, which would confirm the start of a deeper downside move.
Suggested Stop-Loss: $30
Support Levels: 3,997 / 3,845
Resistance: 4,132
Risk Disclaimer:
The views, analysis, price levels, and research presented above are general market commentary and do not represent the platforms official stance. All readers should independently assess the risks and exercise caution when trading.
Disclaimer:
Le opinioni di questo articolo rappresentano solo le opinioni personali dell’autore e non costituiscono consulenza in materia di investimenti per questa piattaforma. La piattaforma non garantisce l’accuratezza, la completezza e la tempestività delle informazioni relative all’articolo, né è responsabile delle perdite causate dall’uso o dall’affidamento delle informazioni relative all’articolo.
WikiFX Trader
AVATRADE
fpmarkets
ZFX
STARTRADER
FXTM
Vantage
AVATRADE
fpmarkets
ZFX
STARTRADER
FXTM
Vantage
WikiFX Trader
AVATRADE
fpmarkets
ZFX
STARTRADER
FXTM
Vantage
AVATRADE
fpmarkets
ZFX
STARTRADER
FXTM
Vantage
Rate Calc


