
Applicazione di richiesta di informazioni sulla regolamentazione dei broker globali
WikiFX
English
简体中文
繁體中文
English
Pусский
日本語
ภาษาไทย
Tiếng Việt
Bahasa Indonesia
Español
हिन्दी
Filippiiniläinen
Français
Deutsch
Português
Türkçe
한국어
العربية
FPG GBPUSD Market Report November 19, 2025
Sommario:On the H1 chart, GBPUSD is moving within a narrowing, conical price channel, signaling a period of consolidation as the market tightens. Technically, patterns like this often point to an upcoming brea
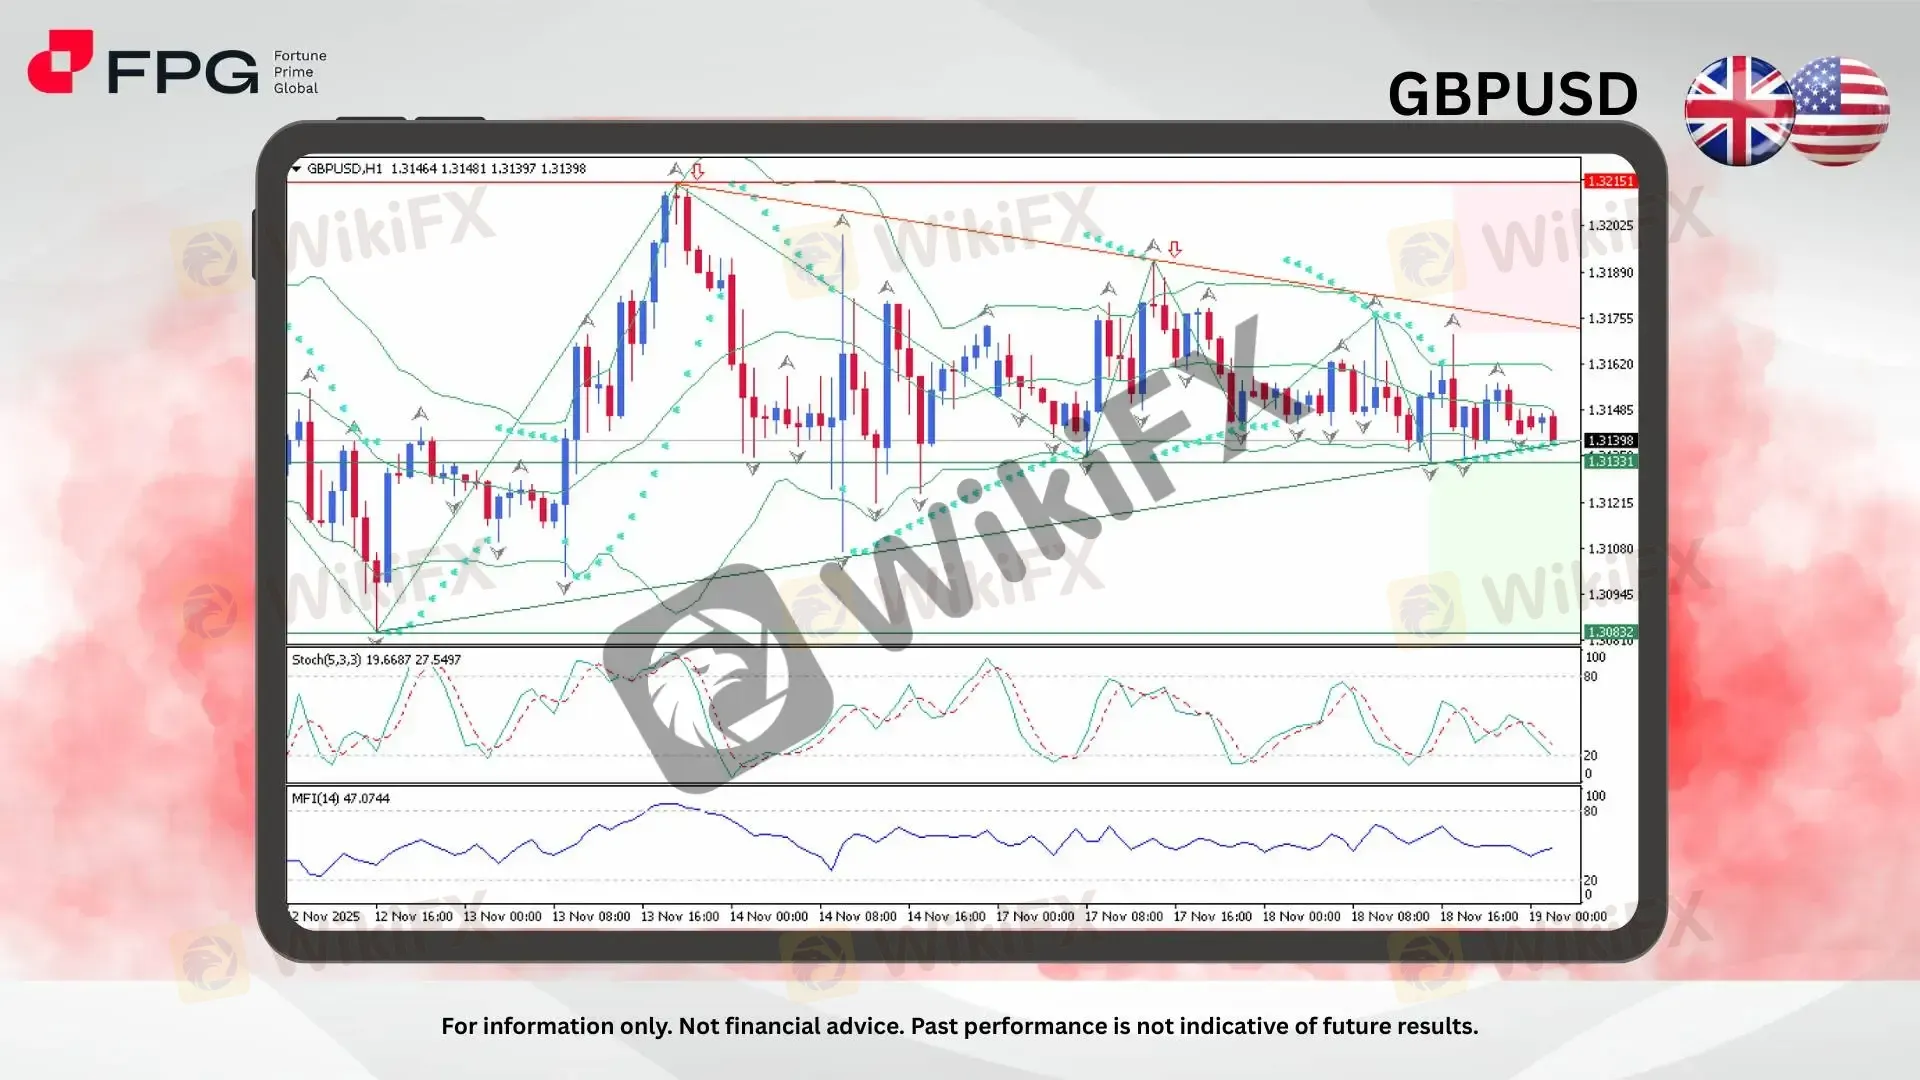
On the H1 chart, GBPUSD is moving within a narrowing, conical price channel, signaling a period of consolidation as the market tightens. Technically, patterns like this often point to an upcoming breakout or a stronger price move as the buildup of pressure begins to resolve. In addition, several important economic releases from both the US and the UK are scheduled today, which could provide the fundamental drivers for the pairs next directional shift. The current price trades around 1.3140, fluctuating near mid-channel support while maintaining slightly higher lows.
Price action is currently compressed between the ascending support trendline and the descending resistance line, marking a classic contracting formation ahead of a breakout scenario. The Bollinger Bands have narrowed significantly, highlighting reduced volatility, while candles are clustering near the middle band, showing strong indecision and balance between buyers and sellers. Parabolic SAR has flipped multiple times, further confirming that directional momentum is weak and the market is in consolidation mode.
The Stochastic Oscillator (5,3,3) is sitting near 19.66/27.54, indicating a mild oversold condition and hinting at potential short-term bullish correction, though lacking strong confirmation. Meanwhile, MFI (14) hovers around 47.07, suggesting neutral flow, neither overbought nor oversold. Until a clear breakout occurs above 1.3180 or below 1.3133, momentum will likely remain choppy and rangebound.
Market Observation & Strategy Advice
1. Current Position: GBPUSD trades around 1.3140, consolidating tightly within a contracting price structure. The pair is holding near ascending support, showing that buyers are still defending the lower edge of the range.
2. Resistance Zone: Immediate resistance lies at 1.3180–1.3200, aligned with the descending trendline and upper channel boundary. A breakout above this area could open the path toward 1.3251, marking a potential shift in sentiment.
3. Support Zone: Key support is located around 1.3133, followed by a deeper level at 1.3083. Sustained movement below these levels could trigger stronger downside continuation toward 1.3050.
4. Indicators: Bollinger Bands are contracting, indicating suppressed volatility and signaling that a breakout may be near. Parabolic SAR continuously flips, reflecting low directional momentum. Stochastic Oscillator signals slight oversold bias, while MFI at mid-levels suggests equilibrium between buyers and sellers.
5. Trading Strategy Suggestions:
Range Trading: Consider short-term buy positions near 1.3133–1.3140, targeting 1.3180, with tight stop-loss below 1.3120.
Breakout Setup: A successful breakout above 1.3200 could offer bullish continuation toward 1.3251 and beyond.
Bearish Bias Below Support: A decisive break below 1.3133 would expose 1.3083, signaling potential downside acceleration.
Market Performance:
Forex Last Price % Change
EUR/USD 1.1582 +0.02%
USD/JPY 155.44 −0.01%
Today's Key Economic Calendar:
UK: Inflation Rate MoM & YoY
US: MBA 30-Year Mortgage Rate
US: Balance of Trade
US: Building Permits Prel
US: Housing Starts
US: EIA Crude Oil & Gasoline Stocks Change
Risk Disclaimer: This report is for informational purposes only and does not constitute financial advice. Investments involve risks, and past performance does not guarantee future results. Consult your financial advisor for personalized investment strategies.
Disclaimer:
Le opinioni di questo articolo rappresentano solo le opinioni personali dell’autore e non costituiscono consulenza in materia di investimenti per questa piattaforma. La piattaforma non garantisce l’accuratezza, la completezza e la tempestività delle informazioni relative all’articolo, né è responsabile delle perdite causate dall’uso o dall’affidamento delle informazioni relative all’articolo.
WikiFX Trader
FXTM
Sotto supervisione
VT Markets
Sotto supervisione
IC Markets Global
Sotto supervisione
ZFX
Reclami dei clienti
FXCM
Sotto supervisione
FOREX.com
Supervisione del paese
FXTM
Sotto supervisione
VT Markets
Sotto supervisione
IC Markets Global
Sotto supervisione
ZFX
Reclami dei clienti
FXCM
Sotto supervisione
FOREX.com
Supervisione del paese
Rate Calc
USD

CNY
Tasso di cambio attuale:0
inserisci l'importo
USD
A disposizione
CNY
Calcolare